

Nightly Build
When we started with RISCOS Ltd, there was a whole lot of newness to developing an Operating System. It's quite different to just tinkering with things, and working to your own standards. One of the first things we set up was the Build Machine. This was a machine that could, at any time, produce an ROM from the latest source, and could be used for testing stuff so that we didn't break our own, working, machines. Also, running a full build was reasonably stressful for the system, and so was a good test of the new build.
It was set up to run builds with !Alarm. By the time we got in to the office in the morning, the clean build of the current checked in source would have been completed. The only thing would be left would be to press Return to accept that this was an experimental build (rather than a release build which would be given a part number and logged in our archive). This usually helped find those odd little build errors that crept in when you didn't test all the components that your change affected. It also gave FileCore a bit of a thrashing, as that was one of the areas that needed testing.
The build would then be used for the day's testing. Occasionally Dave Ward would pop down, pick up the latest build and we'd list the things that we changed since the previous build. He'd run it for a day or so, focusing on the area that we had been working on, and at the end of a day would come down with a short list of things that he had found.
Controlled testing it was not. But we had the right idea with the automated builds. As the full clean build took a while, it wasn't practical to do them all the time.
![]()
!BCTD
One evening I wrote the !BCTD - Build Control Thing Daemon - which was
intended to make it easier to use the build system without having to actively
worry about it. It could run jobs and notify us on completion. Essentially
it was just a TaskWindow with internal buffers, which could run tasks and
notify you of the outcome. The output from the jobs could either be
displayed to the connected session - you just connected with a raw session
and typed line based commands - or to a port on your machine (ttylink, mostly -
as !JFTerm supported that), or to a port you connected to on the build machine,
or to a file. Or it could tail the output as it arrived. It might even have
been able to email you, but I can't remember.
I thought it was pretty useful as a way to control the builds and remove the need to monitor long running builds. We never really used it, though. I don't think that was a bad thing, and it wasn't really a tool we needed, but could have been useful with a bit more work.
FileCore
During our development of RISC OS 4, one particularly fun problem that we encountered was a collection of crashes caused by FileCore. FileCore, in Ursula, had been updated to handle long filenames and much larger discs with a lower 'Large File Allocation Unit' (essentially 'less wastage'). However, this hadn't been finished and there were still issues. After much frustration, it was found that debatching mail and news in !Newsbase could be guaranteed to hit the issues, eventually. It might take a while, but it was a reliable way to provoke the failure.
A machine was set aside to do this. And so it did. Debatching Usenet continuously through the day. Then when it was complete, clearing the files and doing it all over again on the same data. Every couple of hours it would crash and we would have a new log to look at. I say "We". I set up the test system and environment, and Matthew did a lot of the debugging of FileCore - he was far better at that than I.
FileCore had DebugIt debugging, which meant there was a module called DebugIt which could debug to all sorts of destinations - screen, file, memory and others. The memory debugging was useful because we could see the most recent logged output when it failed. There was also the SysLog variant of DebugIt, which meant that you could configure SysLog to log to a remote system using the UDP protocol. We had another machine whose job was to just take the output from the debug enabled FileCore, logging over the network. It sat there, writing lots and lots of data. There was this nice little rattle that sat in the background whilst the tests ran - the test machine debatching, the logging machine recording stuff.
And then the rattling would stop - the test machine had crashed. We would look at the logs, have a poke at memory, add more debugging, maybe a possible check or fix to the code, and rebuild FileCore. Load the new FileCore over NFS, restart ADFS, and rerun the test. So it would repeat.
It wasn't the most complex (or possibly the most efficient) of tests, but it got the job done - FileCore became a lot more stable due the this soak testing. I don't really know how I might have done things differently now, given what I know now and the state that the system was in then.
Acorn had a few mythical Podules called 'The Missing Link'. These were essentially a glorified serial connection between two machines, but they were fast. What went into one Podule was buffered and came out of the other one. They were, apparently, like gold dust, and useful for this form of debugging. We never had any, although we did try to track some down. They might have been used for debugging situations like the FileCore problems, but as we could never get hold of any, we used other methods to debug out code - such as the SysLog network debugging.
Bugz
!Bugz
I'm not sure of the chronology, but around this time we were getting general reports from people, through different channels - especially the registered developers. The quality of reports varied quite a bit, and some people had the test flash ROMs, which had different versions of the software on them. We kept the database of parts we had issued, which meant we could try to reproduce the system they ran on originally. However, knowing what they were running and the problems they encountered was trickier. Initially we produced simple tools like the *ROMPart command which would list the exact part number for the ROM. But that didn't help when we needed to know other details like the modules in the machine and the like.
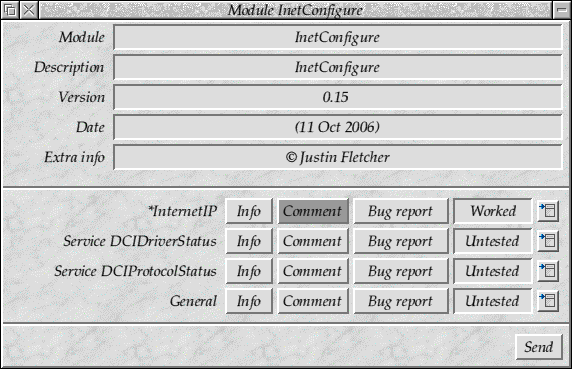
This, coupled with the fact that we would release modules to developers for testing with release notes but not really get much back, made me write !Bugz. The idea was to get structured reports back from people, in the areas we were interested about. The application could be primed for a particular test module through a text description file. The description file could contain a list of areas that we thought there would be issues with, together with descriptions. It could run a block of code in a TaskWindow and capture the output. The results could be automatically emailed to us (at RISCOS Ltd), or to a different recipient as specified in the description file.
As well as the capture of custom data, !Bugz would also record the sender's details (which are always useful if they want a reply!), and all the information which could be collected about the system from SWI OS_ReadSysInfo in its various forms, and the Podules which were present.
Even if there wasn't a custom description file for an application or module, a basic set of details would be offered to provide at report. For applications, the common areas would be offered. For modules, the header would be examined and the interface options offered - SWIs, commands service calls, etc.
Feedback that was provided through the application could be done through an External Edit application - both !StrongEd and !Zap supported this protocol (!Edit did not, but then developers wouldn't be using it as an editor, hopefully). This meant that it was a little more fluid in use, as the editing took place in the user's own editor rather than any custom input fields.
!Bugz used !GMail, which was able to handle just about all the mail queues on the system, so should have been able to pass on the message. If it couldn't, you could save out the email it would produce and you could import it into your mail client manually. The principle that !Bugz was trying to get across was similar to what had been recently implemented in Netscape as Full Circle Reporting (I think it was later called 'Talkback' or something similar). Essentially it would bring reports back to the Netscape developers automatically. Rather than automated crash dumps (which might have been trickier to add), manual reporting was the goal here.
!Bugz was quite nicely documented (at least in my opinion) - it explained what it did, how it worked, and the file format. It could report bugs on modules, or applications that were currently running. Two Wimp messages were defined so that applications could directly communicate with it - either you would click on an application name in !Bugz, and it would ask the application if it had a !Bugz file to use, or the application might provide a 'Report bug' menu option, which would send a message to !Bugz to open a report.
![]()
!Bugz
It wasn't a wonderful application, but I thought it was pretty useful
and I hoped it would encourage a more focused set of reports from
people. I don't remember ever getting much response from people using
it. I'm a little sad at that, as it was a good idea. Oh well.
Actually, now that I think about it, I'm more sad that the little
blue 'Bugs Life' icon wasn't the one that it shipped with.
Addr
The addr tool was created to attack the problem from the other side. There had been other tools which would help debug things, but many were less specific than I'd wanted. Particularly, the where tool (no idea who it was by) would only give information about modules (at least, as I remember). addr was designed to break down regions into nested areas. Each areas had its own description handlers which could describe the areas within it. Not particularly complex, really, but it was incredibly useful in debugging aborts.
Later, I added the ability to debug areas in Absolutes, and using the last abort address (rather than having to enter it by hand). This made debugging errors a bit simpler - if you had an abort, but missed the error message, simply using '*Addr -a' would give you the location of the problem, and the nested locations it lived in.
All in all, Addr was (I think) one of the more useful
tools for debugging failures, especially when you don't have the original
code. BTSDump later made it almost entirely obsolete, but for quite a few
years, Addr was the tool for debugging ![]() .
I think it was pretty fondly
thought of, but like many little tools, it is useful when you need it - but then
completely forgotten.
.
I think it was pretty fondly
thought of, but like many little tools, it is useful when you need it - but then
completely forgotten.
For example, generating an error by using SWI Wimp_ReportError &33445566
could be debugged by using *Addr -a. The
-a uses the location of the last abort as the address to debug.
*addr -a
Address &2217244
  OS: Module area (read/write), at &2100000 offset &117244 (size &2ac000)
    Heap block, at &2216f20 offset &324 (size &1f20)
      Module ErrorLog, at &2216f24 offset &320 (size &1f1c)
        Function currenttaskname, at &22171a8 offset &9c (size &bc)
Because the ErrorLog module is present, it tries to record where the error occurred, but this causes an abort as it tries to read some memory.
Zap code mode
Long before Addr, I did a little work with !Zap. I had written my own extension module - imaginatively named ZapJRF - which provided a number of features that I found useful. The command language used by !Zap didn't provide a lot of the functionality that I wanted to use day-to-day.
I wanted key sequences that just did what I wanted, whatever mode I was in. So if I pressed ctrl-P it would comment out a line, using whatever method was normal for the language mode the editor was in (and ctrl-O to remove the commenting). Similarly, ctrl-G should provide a function header comment for me to fill in, whatever the language. My extension provided conditional execution code for different modes, and depending on what text was at the cursor, as well as special file based execution (so that you should just say 'run these !Zap commands from a file', rather than having the commands all embedded in the main configuration file).
Most of the parts in my module eventually got moved into the core - if they
were sufficiently useful, but it was an important part of my understanding
of how !Zap worked. These days I don't have any configured editor hardly -
because I move from system to system quite a lot it's easier to accept the
defaults on the system rather than being unable to work without my own
particular configuration. Except for 'vi' - I draw the line
at learning how that particular abomination works.
Anyhow, Tim Tyler did a whole load of work on the core of !Zap which was really quite neat. Not all of it was very stable, and I was running a bleeding edge version, sometimes updated a couple of times a day in response to my (and others feedback). It was quite an exciting time. I wanted to do a lot more with the 'Code' disassembly mode, which was part of the core, and I began to attack some bits of it that I thought might be useful.
Initially I focused on module code, adding in header decoding. This added little comments to the start of the module's disassembly to explain what the offsets were used for. At first, they had just been plain values and disassembly, but the decoding made things a lot easier to follow. The same was done for the AIF header, although that is a far smaller section of code to annotate. For example, a module header might be decoded like this:
00000000 : 0000 : 00000000 : Start offset
00000004 : ?000 : 00000080 : Initialisation offset
00000008 : à000 : 000000E0 : Finalisation offset
0000000C : 8100 : 00000138 : Service call handler offset
00000010 : X000 : 00000058 : Title string offset -> InverseTable
00000014 : 4000 : 00000034 : Help string offset -> Inverse Table90.15 (01 Aug 2004)
00000018 : 0000 : 00000000 : Help and command keyword table offset
0000001C : @?00 : 0004BF40 : SWI chunk base number
00000020 : o100 : 000001F4 : SWI handler code offset
00000024 : X000 : 00000058 : SWI decoding table offset
00000028 : 0000 : 00000000 : SWI decoding code offset
0000002C : 0000 : 00000000 : Messages filename offset ->
00000030 : |000 : 0000007C : ANDEQ   R0,R0,R12,ROR R0
I wasn't happy with just this, as it only helped in one instance. I also wanted to know what was being referenced by variables. If you load the address of a string, it's handy to know that it was actually a string pointer that had been read, rather than having to chase the pointers yourself. If you called a function it is incredibly useful to know what the function is - the function signature could include a marker for the function name. The name in the signature was used as part of the backtrace, but could also be used to display the name of functions in a plain disassembly.
I also added special code to identify standard linkage references, and decode those into their function name - no function name signature was present in the stubs, but the order of the dispatch table was fixed.
00008864 : A. á : E1A01141 : MOV     R1,R1,ASR #2
00008868 : 11 á : E1A03101 : MOV     R3,R1,LSL #2
0000886C : .  á : E1A02000 : MOV     R2,R0
00008870 : 0..å : E5901000 : LDR     R1,[R0,#0]
00008874 : .F.â : E28F0F16 : ADR     R0,&000088D4       ; -> string: "Dunno? &%08lx at %p, offset &%08x"
00008878 : !20ë : EB000221 : BL      &00009104          ; call: _printf
The decoded string, in this case, makes it easier to see what the arguments
are to the function. It is quite obvious that this is a call to
printf, passing a message to be printed, with the first and
second format parameter set to the value of the address and the address
respectively. The final format parameter, in R3, being a calculated value, of
R1 with the bottom 2 bits clear (albeit that's an odd way to
clear those bits).
I got quite defensive about my changes after someone destroyed all the
spaced formatting by putting tabs in the source - I still tend to feel very
strongly about using plain spaces over tabs. I wanted to do more clever
things, such as being able to decode other file formats, but I never found the
inclination to do so. There's not as much benefit to doing so. But
eventually, I left it to others to maintain. It did a good job, and I think
that many people who had to work with disassembly in !Zap benefited from it.
Of course, it's still built upon the excellent editor that is !Zap. Dominic
Symes gets my respect for producing such an excellent tool ![]() .
.
Console
!Console
One of the earlier tools I used for debugging (and right up to finally giving up on RISC OS entirely) was a simple application that captured debug into a window. It was born out of a need to record debug information in a simple and unobtrusive way.
Whilst writing modules I regularly wanted to debug what they were doing. I found that Computer Concepts had written a little module, and application, called !VduStream. The module had a number of SWI calls that mirrored the standard output functions - writing characters, strings, limited outputs of characters and the like. It would buffer these and display them in a window in the desktop.
The idea was pretty good, although the application was pretty bad. It was
prone to crashing, and didn't handle control characters very well. It was also
more invasive than I liked, and had an additional support cost in that the
!VduStream application had to be available to see the output. It could also
be set to capture all output which was generated through VDU 4
which was rather useful.
The modules I wanted to debug were all written in !JFPatch and I had created a
REM macro statement to provide debugging. You could (for
example) write REM "Service call %&1" to print out the service call
number from register 1 in hex. The code would be compiled reasonably
efficiently as SWI operations inline in the code, and wouldn't affect the
registers or processor flags. This made it very easy to write useful debug
code. I wanted to use the !VduStream system because it really was quite
a nice interface.
If enabled - in the front end there was a menu option, and from the command line there was a switch - !JFPatch would change the standard SWI calls to !VduStream SWI calls, which would cause it to output there, rather than to the screen. It was very useful to be able to switch the debug modes in and out, and leave the code the same.
However, I found that the !VduStream application was increasingly unstable as time went on, and it was very easy to cause it to crash, losing all your debug. For similar reasons as the !VduStream, I wrote a little module called Console and the associated application. Its origins came from the SunOS systems we used at University, which would normally record NFS automount problems to the console. If you were in X (which was the normal case), you would never see these. So instead, you ran a little X application which displayed the console messages.
My module did a similar thing, and a similar thing to the !VduStream
application when run in capture mode. It sat on WRCHV and checked
for output which occurred whilst in VDU 4 (text output) mode,
when you weren't in a TaskWindow but were in the desktop. The advantage of
this was that you could press F12 to get to the command line, and everything
worked fine, but debug in the desktop would be captured. Essentially all your
debugging code needed to do to write to the console was to use
VDU 4 : PRINT "message" or the equivalent in assembler, or C.
The !Console application itself pulled complete lines from the back end
module's buffer, and displayed them in a window. The display was just one of my
DispLib windows, so was tailored for looking at the last lines of
the window. The application didn't crash, and neither did the module, so it
was an improvement over !VduStream.
If you ever saw applications spew out debug information at the top left of the screen, it was probably written with !Console (or something similar, like !VduStream) in mind. I was really pleased with the application, and it was a permanent fixture in my boot sequence because it was so universally useful. I'm not sure if anyone else used it, but it was invaluable in debugging many parts of the OS, from filesystems to Toolbox gadgets. Particularly the animations in the gadgets, and other new operations which could get a bit fiddly.
Benchmarking
As part of the work towards getting the abstracted video working efficiently - and showing that it was - we needed some form of benchmarking tool which we could rely on. Something that tested known states and which were obvious as to what it was doing. Other benchmarks existed, but most focused on the overall system performance, rather than individual API performance.
Rather than writing individual tests for the specific API which was being exercised (and usually forgetting about them), I wanted to have a little program that I could run to measure the performance. The goal was to provide useful information that I could take away and compare to other systems, or previous iterations. This wasn't a unit test - it was intended purely to measure the speed of operations to ensure that under known circumstances the system would give consistent results. And hopefully show that they improved.
The Benchmarker actually started out by testing out the MimeMap module, I believe, when testing the performance of the extension lookup (which is used a huge amount on network filesystems, CDs, DOS discs and any other network sourced data), and for the wildcard handling (which was new and had a significant impact on the lookup of types that were otherwise unknown). However, because of the simple way that it was written - lots of little BASIC libraries that you could test individually - it was simple to extend to other areas, with the graphics system being a good area to test.
Many of the graphics operations were tested through the Benchmarker and the last statistics I remember seeing were that the new software vectored calls were quite a bit slower than their old in-the-kernel versions. Understandable, in some respect, as you cannot vector operations without it costing a little, but the scale of the slow down was quite significant.
The tests that the Benchmarker could do also included a whole bunch of Wimp operations which had been improved, and some which verified that the memory management changes for dynamic areas (particularly heap dynamic areas) were really worthwhile. The gains on the latter were really quite amusing, with some operations which used to take a second being reduced to under a centisecond.
The intention with the Benchmarker had been that it would be released out to people, so that they could test their own components in a similar way. Any slowdowns that were reported could be shown through the Benchmarker, and - being in BASIC - it would be easy for just about any developer to be able to produce a test case if they were so inclined. I had hoped to wrap the whole tool in a more friendly application which would collect the results, and retain them so that it was possible to produce reports over time. Maybe even keep a record of what modules were running when they were run to report the differences.
Disclaimer: By submitting comments through this form you are implicitly agreeing to allow its reproduction in the diary.